Check the Products Upsold area
What this article covers
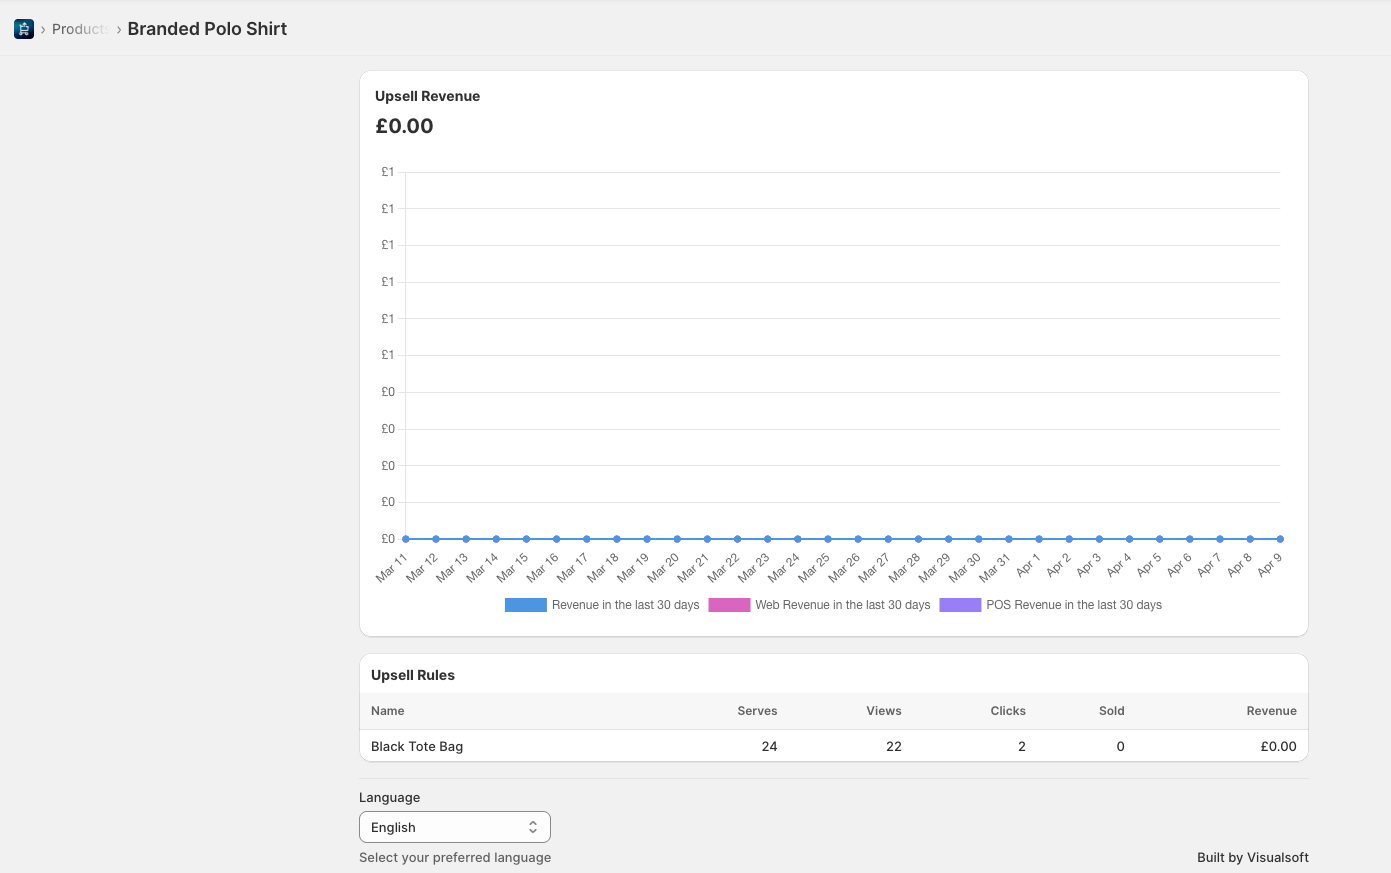
Use this guide to find the Products Upsold area for a product in Impulse and understand the information shown there. This includes the Upsell Revenue chart and the Upsell Rules table with columns for Name, Serves, Views, Clicks, Sold, and Revenue.
Open the Products Upsold area
In Impulse, go to Products.
Select the product you want to review. When the product page opens, you will see a breadcrumb similar to Products > Branded Polo Shirt.
On the product page, scroll to the analytics area that shows Upsell Revenue at the top and Upsell Rules underneath.
What you can see in this area
Upsell Revenue
The Upsell Revenue card shows how much revenue that product has generated through upsells.
- The large value at the top shows the current total, such as £0.00.
- The chart displays performance over time.
- The legend below the chart separates revenue by channel:
- Revenue in the last 30 days
- Web Revenue in the last 30 days
- POS Revenue in the last 30 days
This helps you see whether a product is performing through online upsells, POS upsells, or both.
Upsell Rules
The Upsell Rules table shows which rule is using that product as an upsell and how that rule is performing.
Each row includes:
- Name — the upsell rule name, such as Black Tote Bag
- Serves — how many times the rule was served
- Views — how many times customers saw it
- Clicks — how many times customers clicked it
- Sold — how many units were sold from that upsell
- Revenue — revenue generated by that rule
Use this table to understand which rules are attached to the product and whether those rules are converting.
How to read the numbers
When Serves is high but Clicks are low
If Serves and Views are increasing but Clicks stay low, the upsell is being shown but is not attracting enough interest. The offer may need a more relevant trigger product or a stronger upsell product match.
When Clicks are high but Sold is low
If customers click the upsell but Sold stays low, the product may be interesting but not compelling enough to complete the purchase. Review the product choice, price, or placement.
When Revenue is zero
If the chart shows £0.00 and the table also shows Revenue as £0.00, that means the product has not yet generated upsell sales during the period shown.
Use the page to identify what to improve
The Products Upsold area is most useful when you review both the chart and the table together:
- Check the Upsell Revenue chart to see the overall trend.
- Check the Upsell Rules table to find the exact rule driving the results.
- Look for rules with high Views but low Clicks or low Sold.
- Compare Web Revenue in the last 30 days and POS Revenue in the last 30 days to see which channel is working better for that product.
Language setting on the page
At the bottom of the page, Impulse shows a Language dropdown. In the example screen, it is set to English. Use this setting if you need to view the page in the available app language.
Why you might not see useful data yet
- The product may be attached to a rule that has not been active long enough.
- The rule may not be getting enough Serves or Views.
- The rule may not be configured for the right sales channel.
- The product may not have been added under Upsell Products in an active rule.
Quick checklist
- Open Products.
- Select the product you want to inspect.
- Find the Upsell Revenue card.
- Review the Upsell Rules table.
- Compare Serves, Views, Clicks, Sold, and Revenue.
- Use the results to decide whether the upsell rule needs adjusting.